Louis Teitelbaum
Home
Projects
Blog
Art and Design
CV
Categories
All
(4)
DataViz
(4)
Meta-Science
(1)
Python
(1)
R
(2)
Shiny
(1)
Streamlit
(1)
Web Apps
(2)
ggplot2
(2)
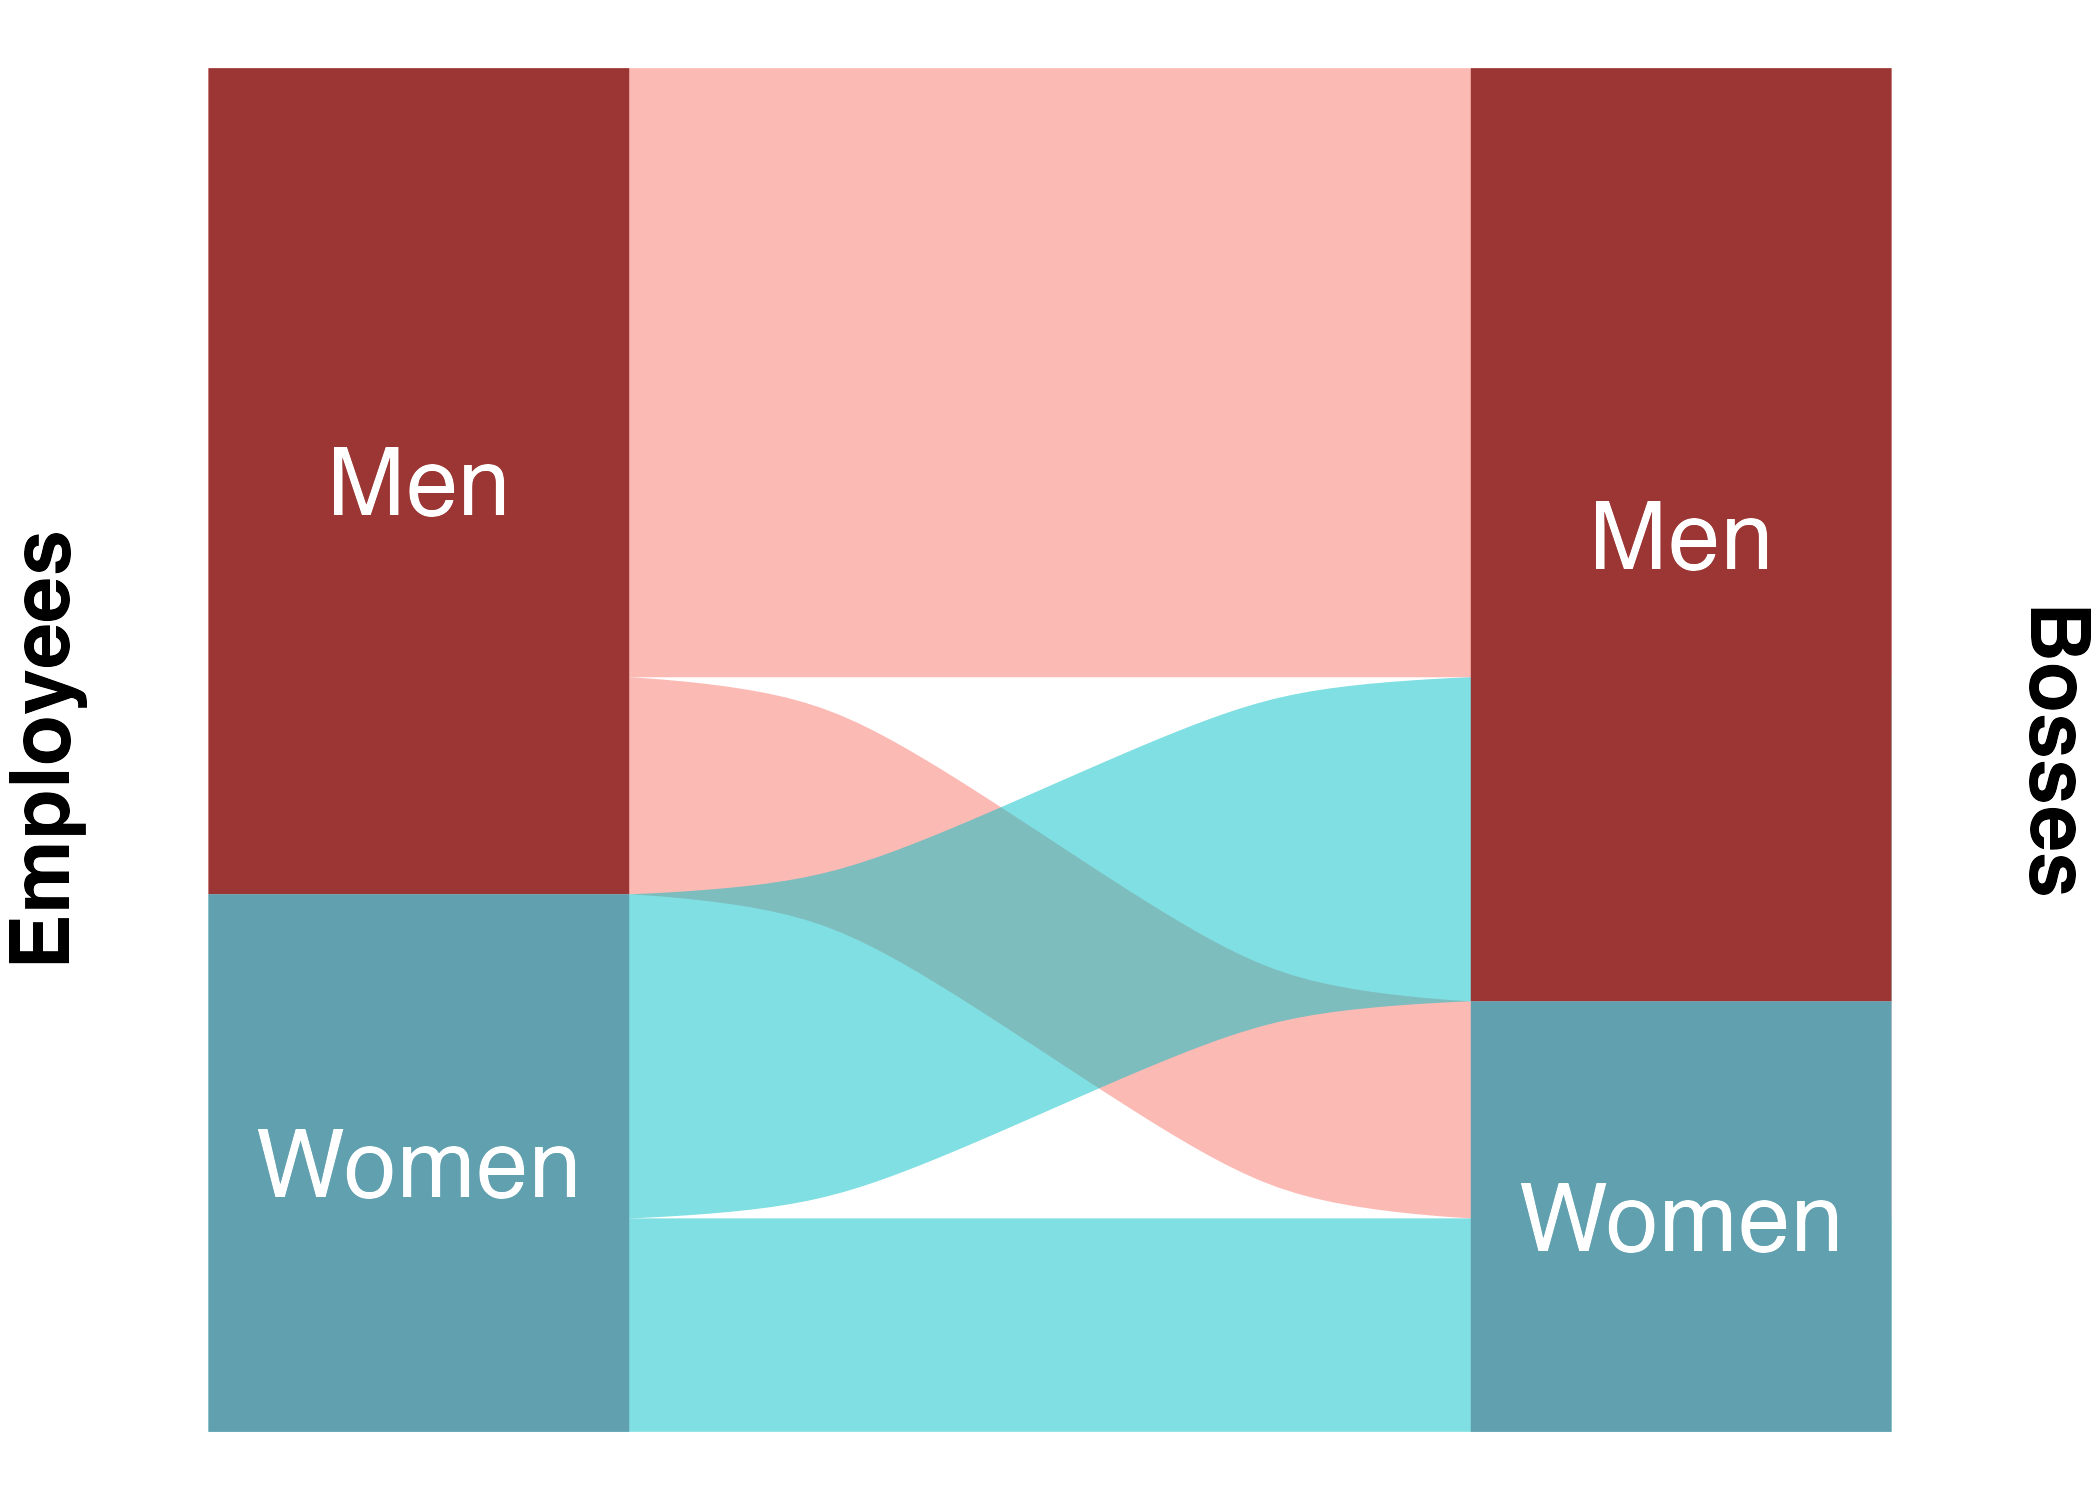
hire_your_clone
DataViz
Shiny
Web Apps
An interactive web app for exploring patterns in boss-employee pairings among high-level executives.
Louis Teitelbaum
Jul 2, 2023
wormsplot
R
ggplot2
DataViz
A worms plot is an elegant way to visualize historical (or fictional!) characters as they move from place to place. Expanding on
ggplot2
, this package provides a new geom,
geom_…
Louis Teitelbaum
Apr 16, 2023
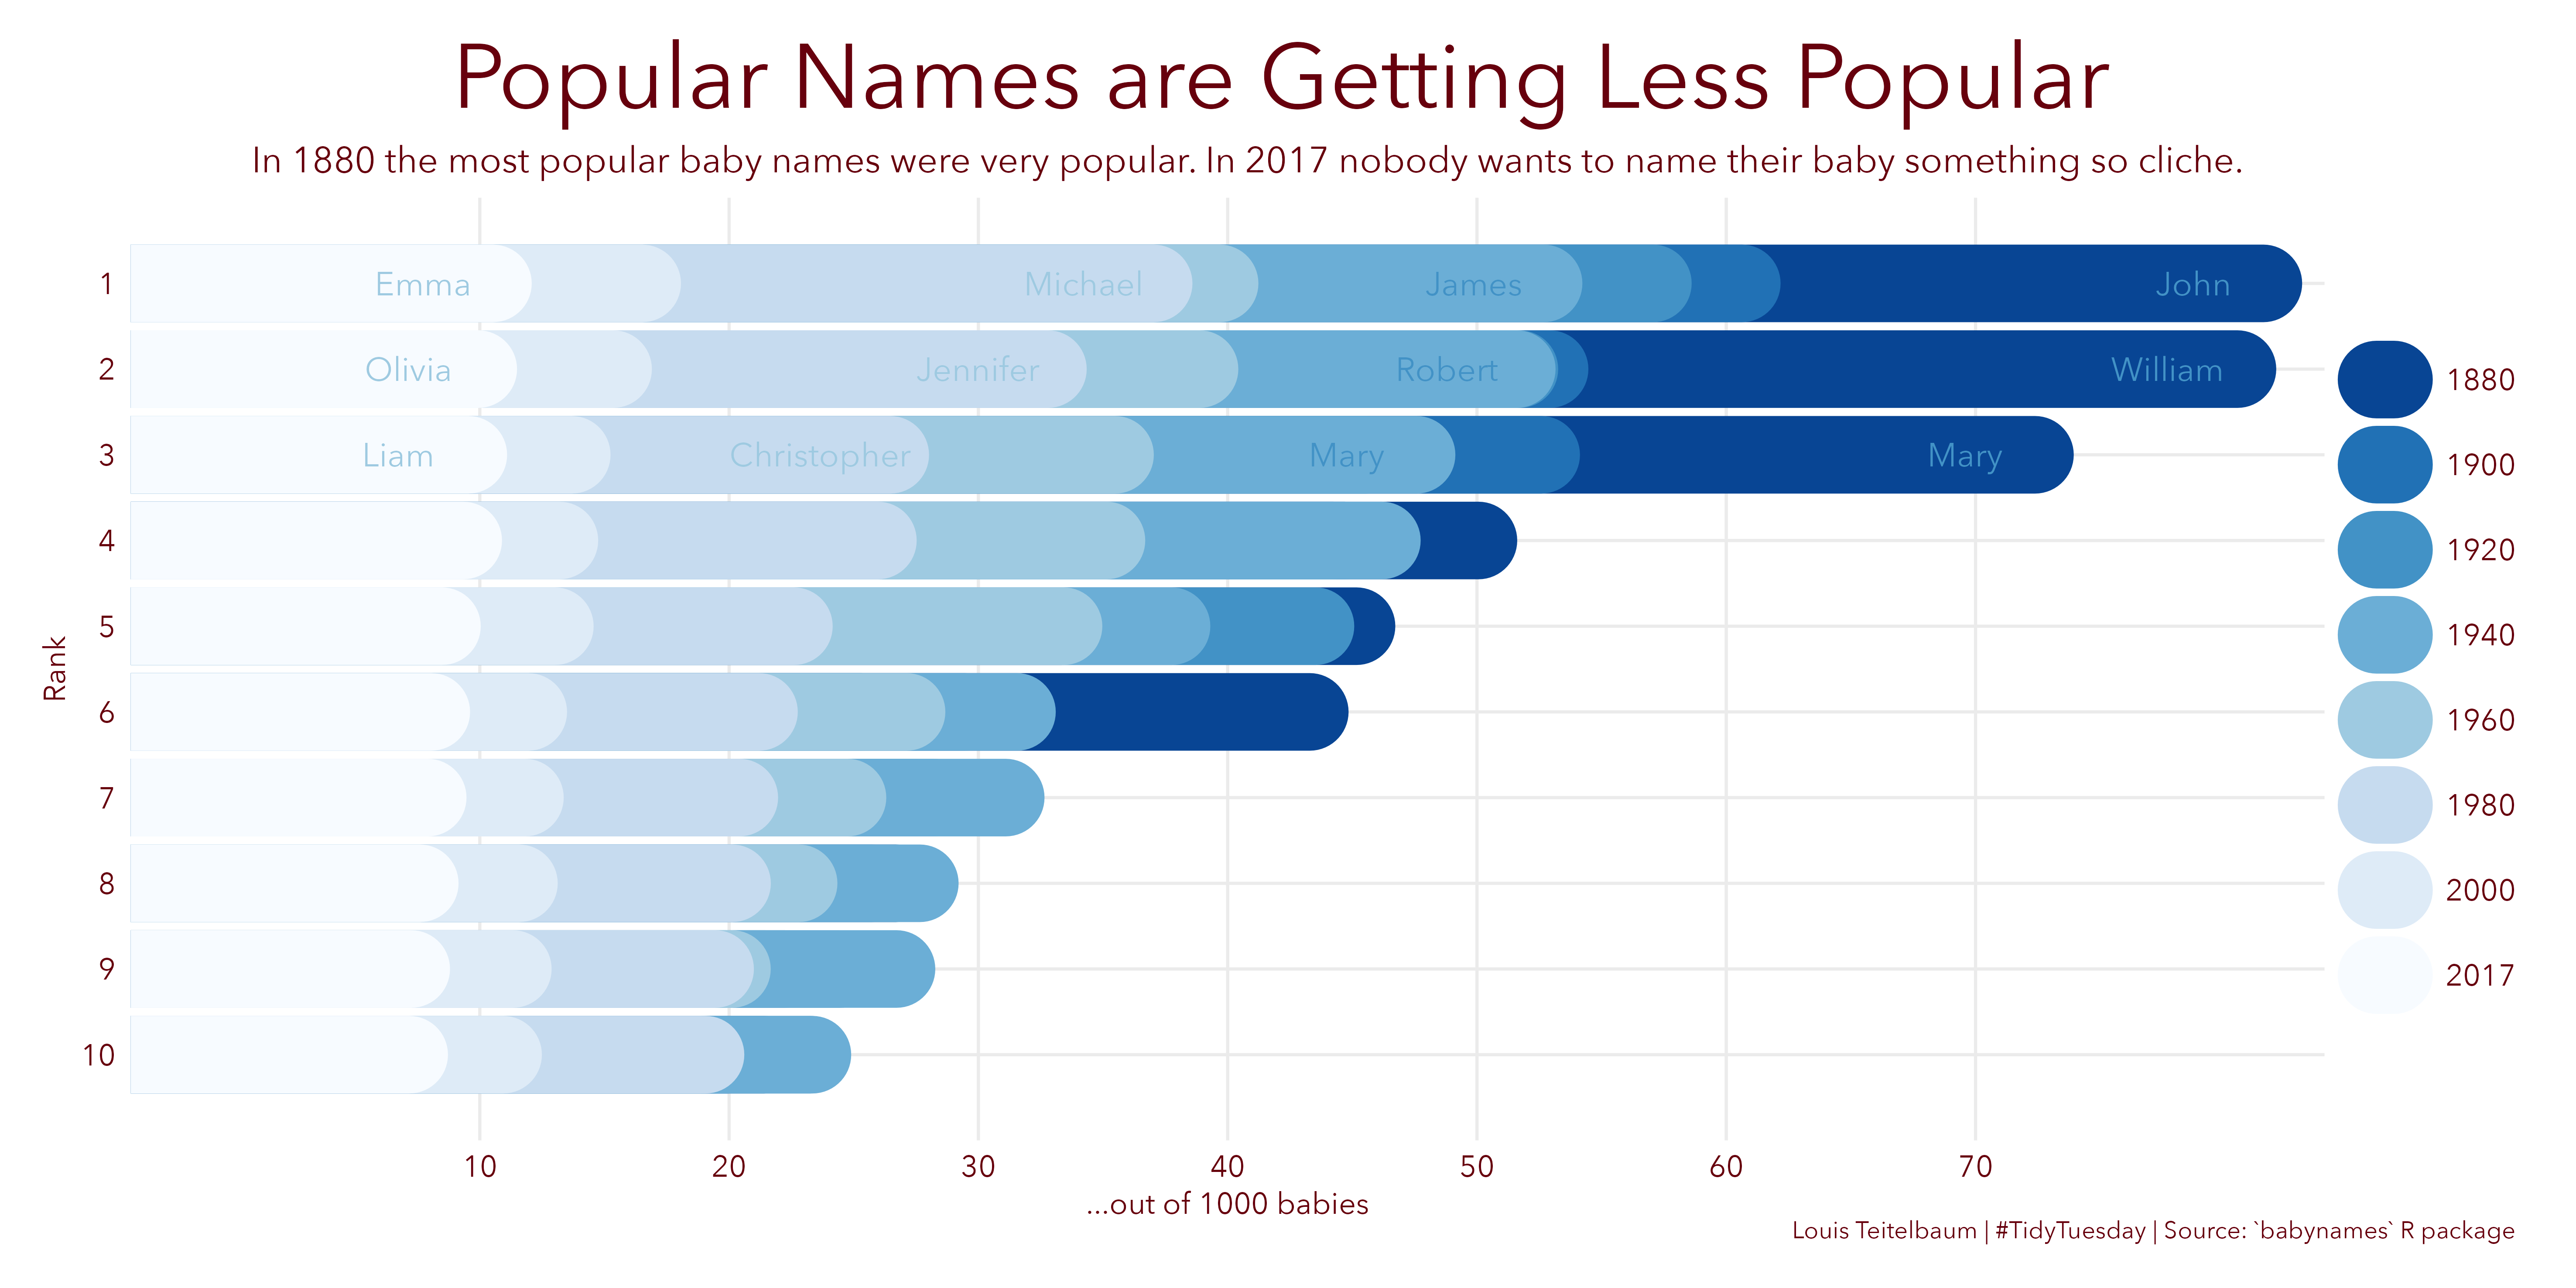
My #TidyTuesday contributions
R
ggplot2
DataViz
#TidyTuesday is a data visualization weekly challenge. Every week, the organizers post a raw dataset and challenge the community to tell a story with it.
Louis Teitelbaum
Mar 28, 2023
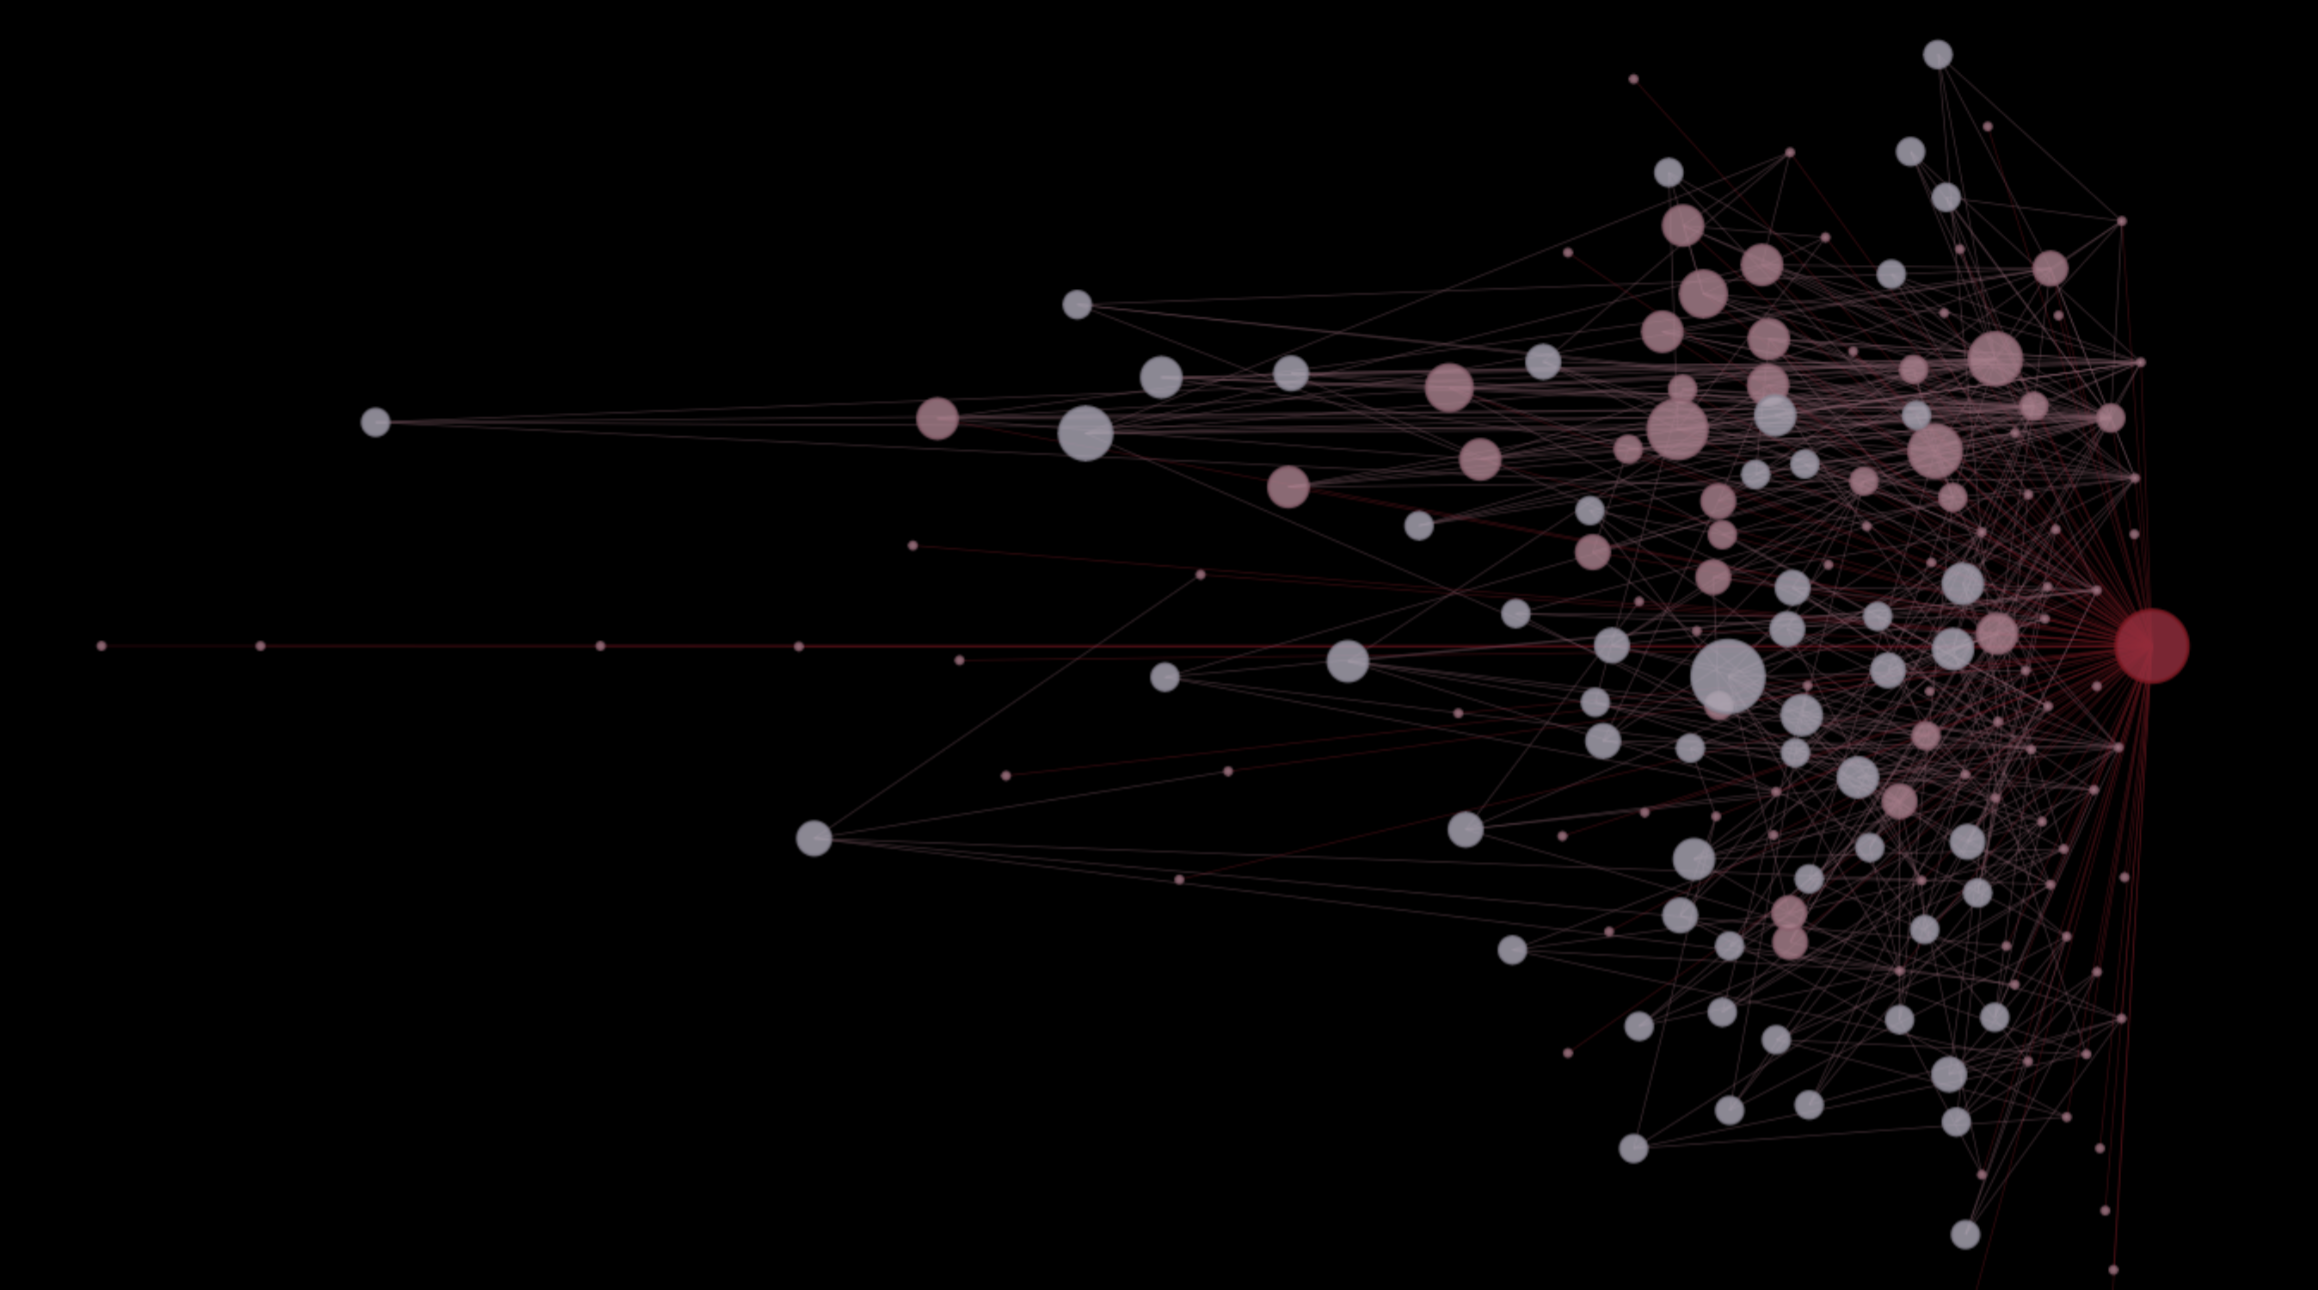
paper_provenance
Python
Meta-Science
DataViz
Streamlit
Web Apps
An interactive web app for visualizing the history of a field leading up to a paper.
Louis Teitelbaum
Mar 28, 2023
No matching items