# install.packages("devtools")
devtools::install_github("rimonim/wormsplot")wormsplot
R
ggplot2
DataViz

A worms plot is an elegant way to visualize historical (or fictional!) characters as they move from place to place. Expanding on ggplot2, this package provides a new geom, geom_worm, which allows for an arbitrary number of moves within each worm, and takes intuitively structured data input. The package also includes a convenience function, wormsplot, for generating aesthetic plots with minimal effort.
Installation
You can install the development version of wormsplot from GitHub with:
Example
Here is a plot of the lives of scientists who won the Nobel Prize for physics between 1901 and 1907.
library(dplyr, warn.conflicts = FALSE)
library(ggplot2)
library(wormsplot)

data(nobel_physicists)

nobel_physicists %>%
  filter(name %in% head(unique(name), 10)) %>%
  mutate(country = forcats::fct_drop(country)) %>%
  wormsplot('year', 'country', 'name', worm.color = 'initial',
            worm.args = list(linewidth = 5.1, lineend = 'round'), region.label.width = 22, label.args = list(size = 3.6)) +
  labs(title = "The Lives of Winners of the Nobel Prize in Physics 1901-1907")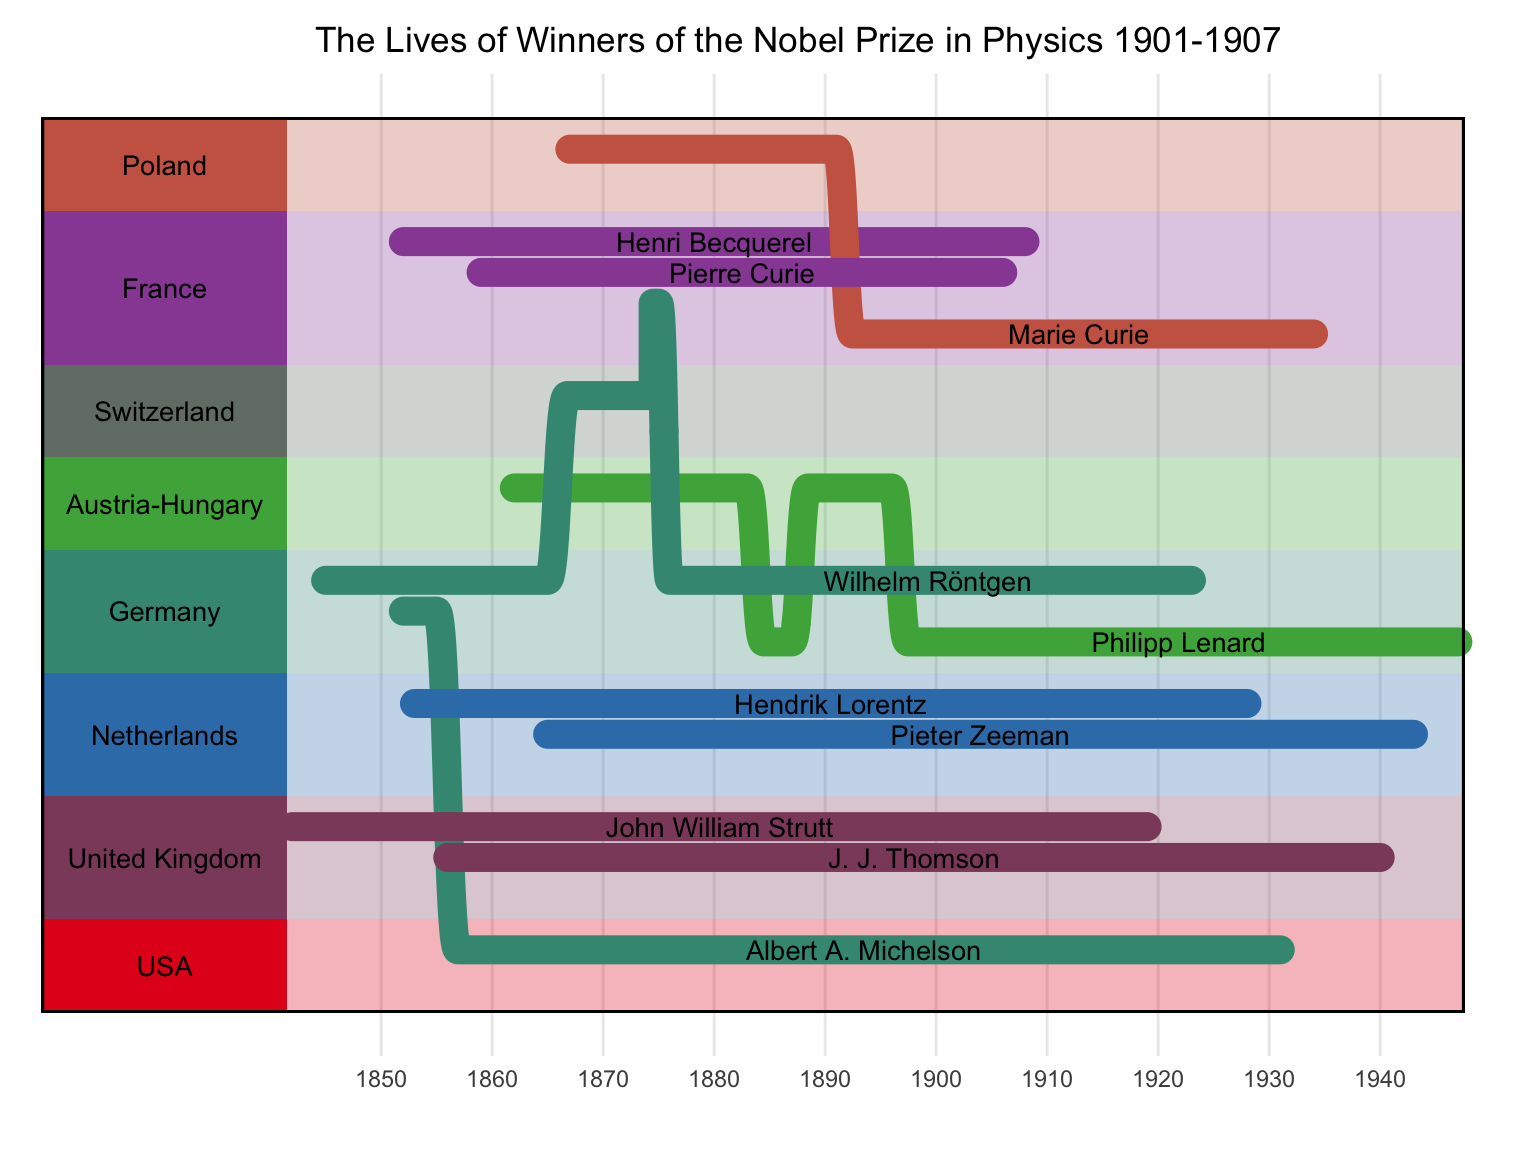
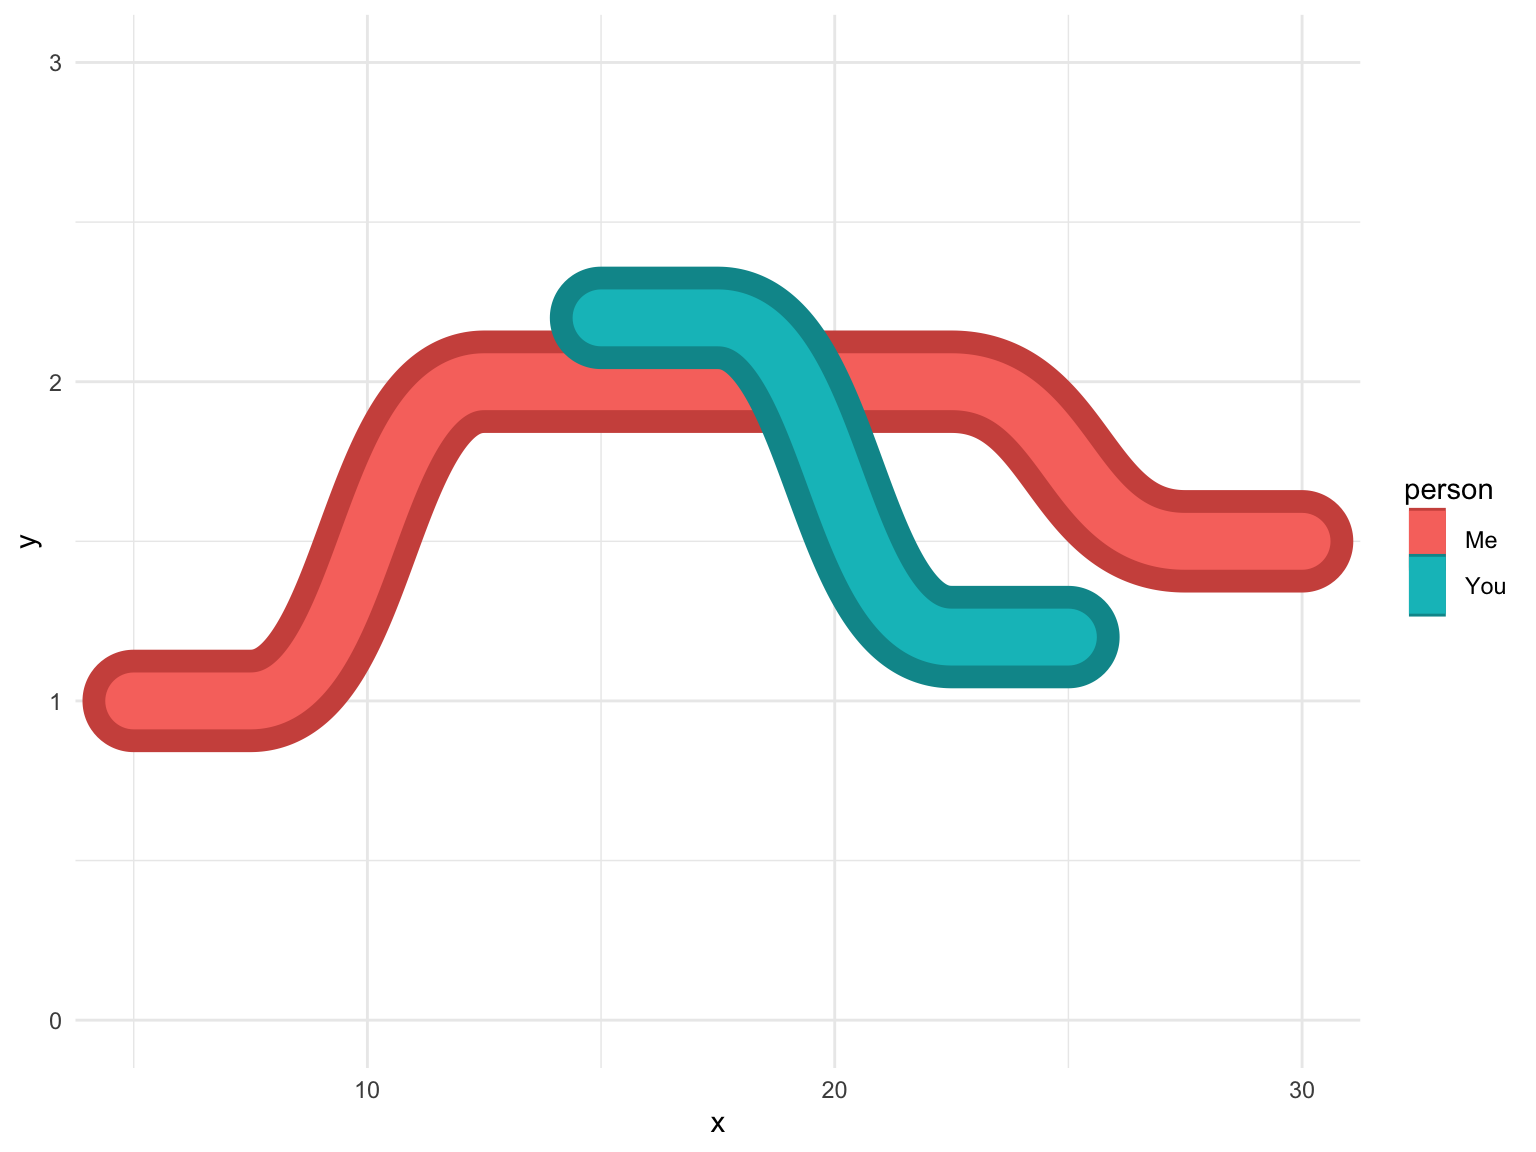
Plots can also be built from scratch using geom_worm() or stat_worm():
library(colorspace)
library(ggborderline)

data <- data.frame(
  x = c(5, 10, 25, 30, 15, 20, 25),
  y = c(1, 2, 1.5, 1.5, 2.2, 1.2, 1.2),
  person = c('Me', 'Me', 'Me', 'Me', 'You', 'You', 'You')
  )

ggplot(data, aes(x, y, group = person, color = person, bordercolor = after_scale(darken(colour, .2)))) +
  stat_worm(linewidth = 10, shorten_lines = 10, geom = 'borderline', lineend = 'round') +
  theme_minimal() +
  scale_y_continuous(limits = c(0, 3))